Serverless monitoring of Steam server lists
Multiplayer games published on Steam often add their dedicated servers to a public Steam server list. This list is basically a backend service provided by Steam which can be queried in-game to browse and filter game servers and their state.
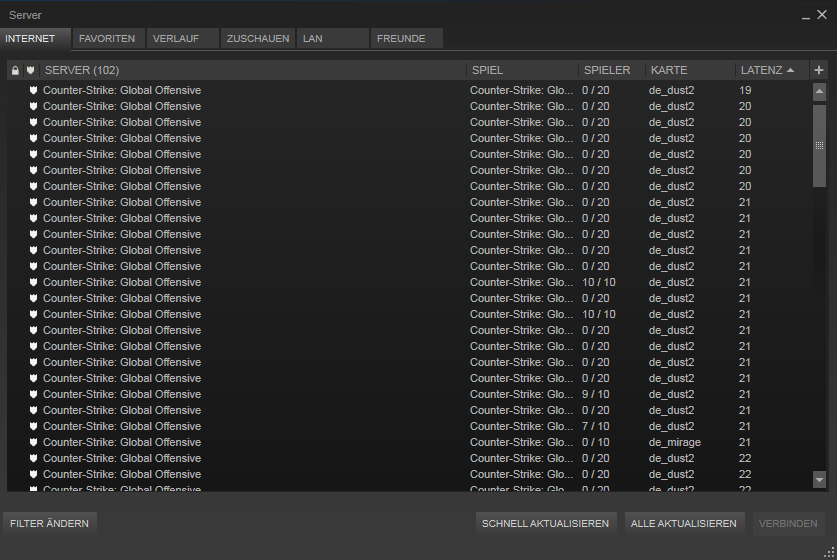
When utilizing this server list, it may happen that dedicated servers for a game are up and running, but the Steam server list for this very game is empty. Cause of this might be, for example, a communication failure when updating the server list.
If you are only monitoring the dedicated servers, you might never notice that the server list is empty until players start complaining on social media.
Therefore, it is a good idea to monitor the Steam server list.
Scope of this post
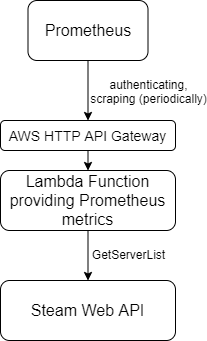
This post presents a solution how to monitor the Steam dedicated server list for a game using an AWS Lambda function and a Prometheus (or compatible) monitoring service.
Alternatives
Steam server information can be retrieved directly from the dedicated servers by using the UDP based A2S protocol (if enabled). There is a Prometheus exporter available for this: https://github.com/armsnyder/a2s-exporter
However, this exporter does not provide the state as seen by the player. Also, it uses the unreliable UDP protocol which can raise false alerts. Instead, it is better to directly monitor the public server lists.
Reliably retrieving the Steam server list
In order to query the public Steam server list for a game in a reliable way, I strongly suggest to use the Steam Web API. Other kind of queries will sometimes report empty lists which can cause false alerts.
Simply register for an API key using your Steam account (it is free): https://steamcommunity.com/dev/apikey
According to the conditions, you need to make sure not to run too many queries per day, but querying once a minute for monitoring should be fine.
The serverlist can be queried using the Steam API function GetServerList, which is not officially documented. See for example https://gist.github.com/Decicus/5d6eb057da4b5f228a4f1c2334ce1e2f
Calculating Prometheus metrics
The data returned by GetServerList is used to calculate metrics which are fed into a Prometheus exporter. This is pretty straightforward, as there are Prometheus “client” libraries available which simplify writing an exporter. Example code (Golang):
var (
	totalNumPlayers = prometheus.NewGauge(
		prometheus.GaugeOpts{
			Namespace: "steam",
			Name:      "total_num_players",
			Help:      "Total number of players on all servers",
		})
	totalNumServers = prometheus.NewGauge(
		prometheus.GaugeOpts{
			Namespace: "steam",
			Name:      "total_num_servers",
			Help:      "Total number of servers",
		})
	numNonEmptyServers = prometheus.NewGauge(
		prometheus.GaugeOpts{
			Namespace: "steam",
			Name:      "num_non_empty_servers",
			Help:      "Number of non empty servers",
		})
)
//...
registry := prometheus.NewRegistry()
registry.MustRegister(totalNumPlayers)
registry.MustRegister(totalNumServers)
registry.MustRegister(numNonEmptyServers)
// Use Steam Web API to query the server list (this function is available in the github project)
servers, err := webrequest.RequestGameServers(webrequest.GetFilterForAppId(steamAppId))
//...
tmpTotalPlayers := 0
tmpTotalServers := 0
tmpNumNonEmptyServers := 0
for _, s := range servers {
  tmpTotalPlayers += s.Players
  if s.Players > 0 {
    tmpNumNonEmptyServers++
  }
  tmpTotalServers++
}
totalNumPlayers.Set(float64(tmpTotalPlayers))
totalNumServers.Set(float64(tmpTotalServers))
numNonEmptyServers.Set(float64(tmpNumNonEmptyServers))
//...
Serverless metrics using a Lambda function
A Prometheus exporter written in Go is a standalone application waiting for http get requests and sending metrics as a response. This application needs to be run somewhere in a fail-safe environment, so that Prometheus is able to periodically collect the Steam server list metrics.
Even though it might look like making things more complex at first sight, a serverless approach using AWS Lambda helps to avoid high administration efforts:
The Prometheus exporter can easily be modified to be deployed as a stateless serverless function. This is achieved by mapping the default http handler used by Prometheus to a simple Lambda handler and by collecting the metrics each time the Lambda function is called.
// Implementation of http.ResponseWriter to map Lambda to Prometheus http
type LambdaResponse struct {
	Body       string
	StatusCode int
}

// The incoming http Header is not used by Prometheus.
func (r *LambdaResponse) Header() http.Header {
	return http.Header{}
}

// Append Prometheus data to Lambda response variable.
func (r *LambdaResponse) Write(data []byte) (int, error) {
	r.Body += string(data)
	return len(data), nil
}

// Set Lambda status code from Prometheus.
func (r *LambdaResponse) WriteHeader(statusCode int) {
	r.StatusCode = statusCode
}

// Implementation of lambda function handler. Use Prometheus http handler by mapping callbacks to lambda.
func handler(request events.APIGatewayProxyRequest) (events.APIGatewayProxyResponse, error) {

  //... (register and update Prometheus metrics, see above)

	// Map prometheus http handler to Lambda.
	var httpRequest http.Request
	httpRequest.Header = request.MultiValueHeaders
	var lambdaResponse LambdaResponse

	promhttp.HandlerFor(registry, promhttp.HandlerOpts{}).ServeHTTP(&lambdaResponse, &httpRequest)

	// Return Prometheus handler data as Lambda result.
	return events.APIGatewayProxyResponse{
		Body:       lambdaResponse.Body,
		StatusCode: lambdaResponse.StatusCode,
	}, nil
}
Last but not least, this Lambda function is mapped to an AWS HTTP API gateway, which will also handle authentication to avoid invalid calls. The complete example source code is available on github, it can be build using the AWS SAM CLI to create the function and HTTP gateway.
See https://github.com/lotodore/serverlist-metrics
Authentication
The example code does not include any authentication, which means that the metrics are publicly available. I would suggest to add authentication to the HTTP API gateway (or use VPC) according to your requirements, otherwise people could cause costs by calling the metrics function. Prometheus supports several authentication methods when scraping metrics.